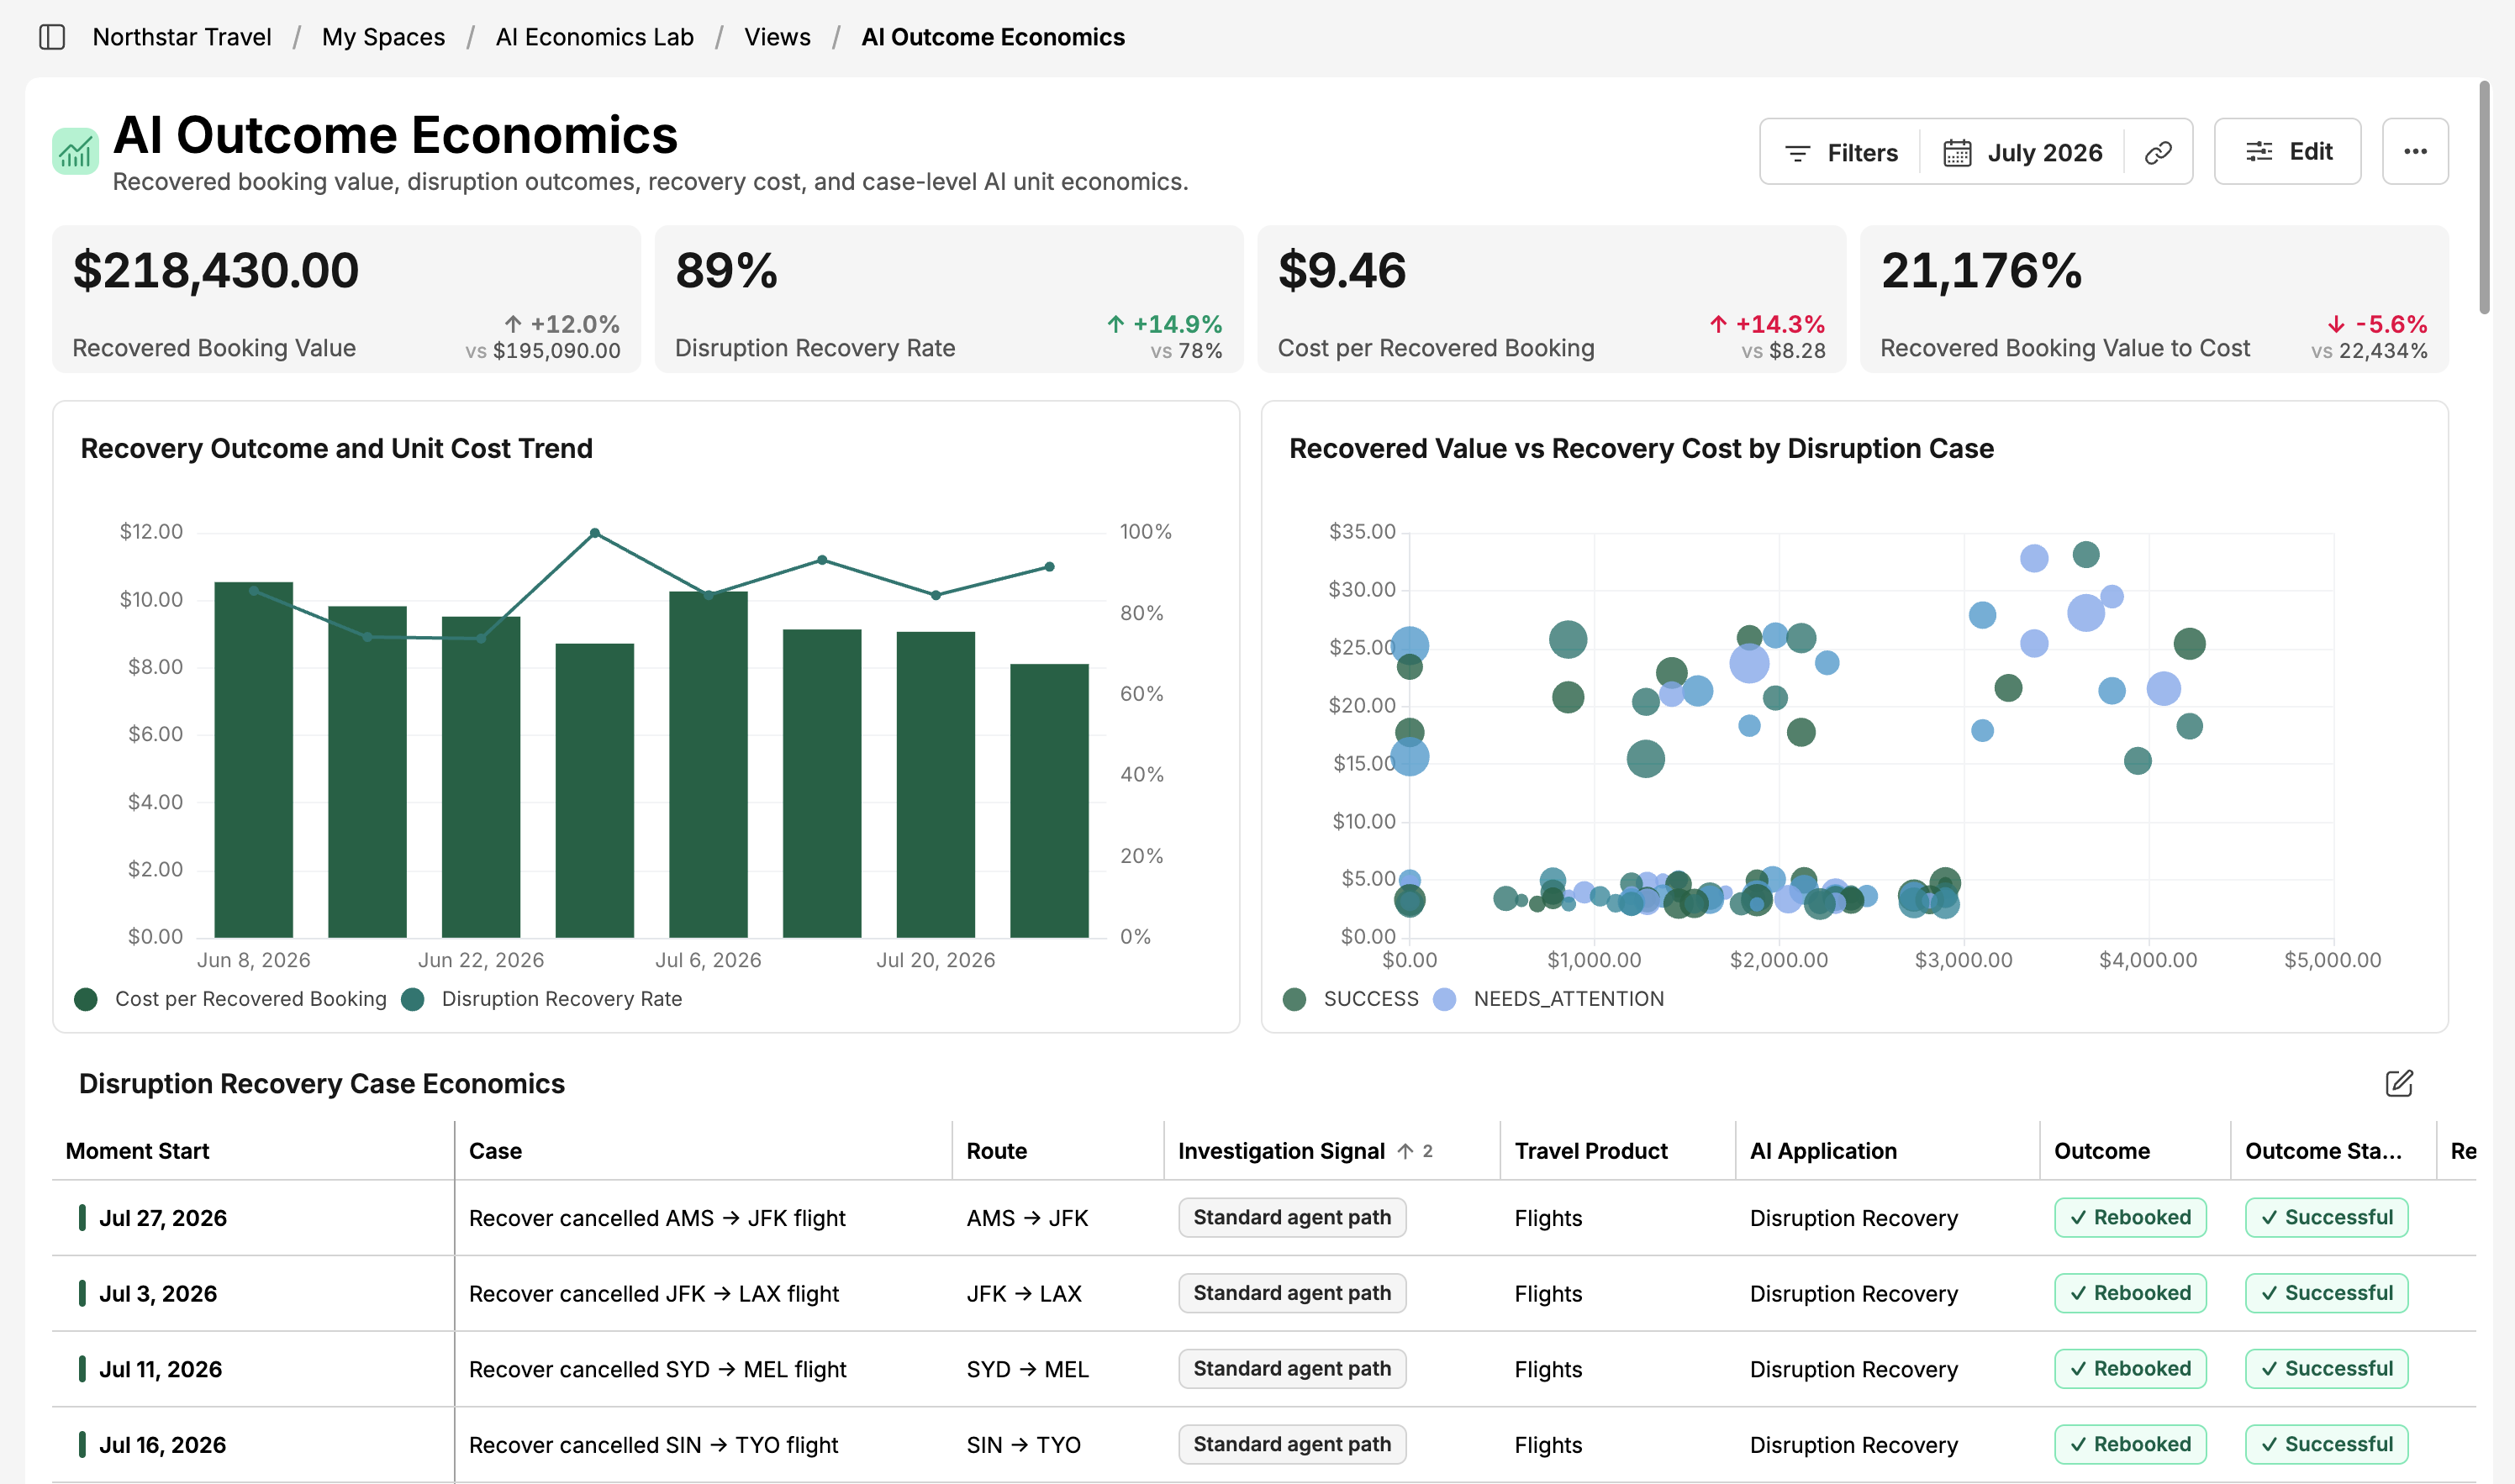














Three numbers the board asks for and nobody can source
The hard part is not seeing cost. It is turning cost into a number about the business, one that finance, product, and engineering all accept.
Cost to serve a customer
Cloud by tag, plus the support tickets, SaaS seats, and AI assistant that customer used. One number, with an owner and a source line.
Margin per product line
Attributable cost against recognised revenue, at the grain where revenue actually occurs. Contribution, not a spread average.
Cost per unit of work
Per transaction, per booking, per resolved ticket. You pick the unit. The pipeline computes it every run.
Cost per order, in four steps
A non-AI example with example figures, computed the way the model computes it every run. Every figure traces back to the source lines and the rule that allocated them.
- 01Collect the costs
Cloud bill €48,700, fulfilment SaaS €6,200, support platform €3,900. €58,800 for the month.
- 02Allocate by usage
Rules place €41,300 on checkout and fulfilment services. The €17,500 of shared cost is split by measured share, visibly.
- 03Divide by the unit
61,000 orders shipped. €58,800 ÷ 61,000 = €0.96 cost per order.
- 04Compare where revenue exists
Against €4.10 gross margin per order, and by segment: the loss-making delivery region stops hiding in the average.
Three inputs, and margin needs the third
Cost per unit works with the first two. Margin and contribution need revenue, recognised at the grain where it is earned, supplied by you.
Cost sources
Cloud billing exports, SaaS and licence costs, support platforms, labour: the costs that serve customers.
Usage and business data
Orders, cases, tickets or transactions with identifiers that map them to customers, products and services.
Revenue, where available
Recognised revenue per product or customer from your CRM, ERP or billing system, joined at the same grain.
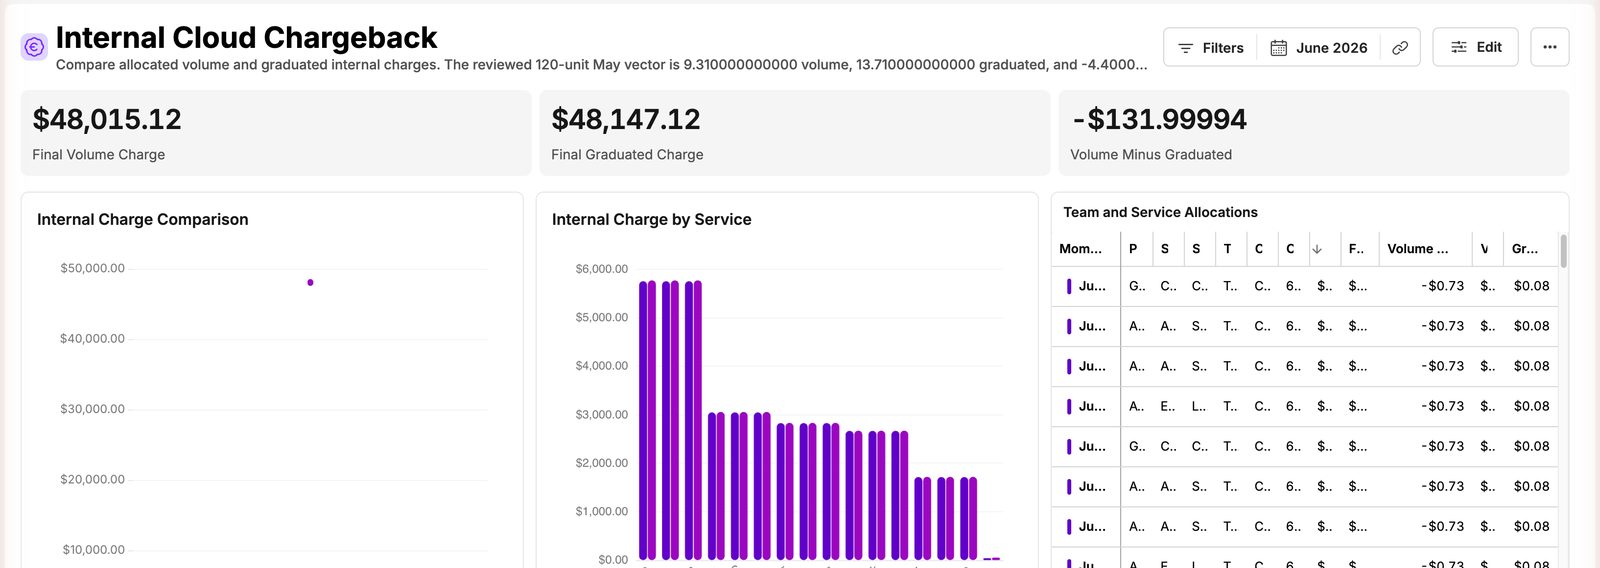
A margin next to every product line
Start from a working example on demo data, then connect your own sources. Every view reads from the governed model, so the contribution figure on the board pack is the sum of the source lines behind it.
Shared cost, spread by measured demand
Platform teams, reserved capacity, and cross-team services allocated by what each product consumed. Remainders are explicit and totals tie back to source.
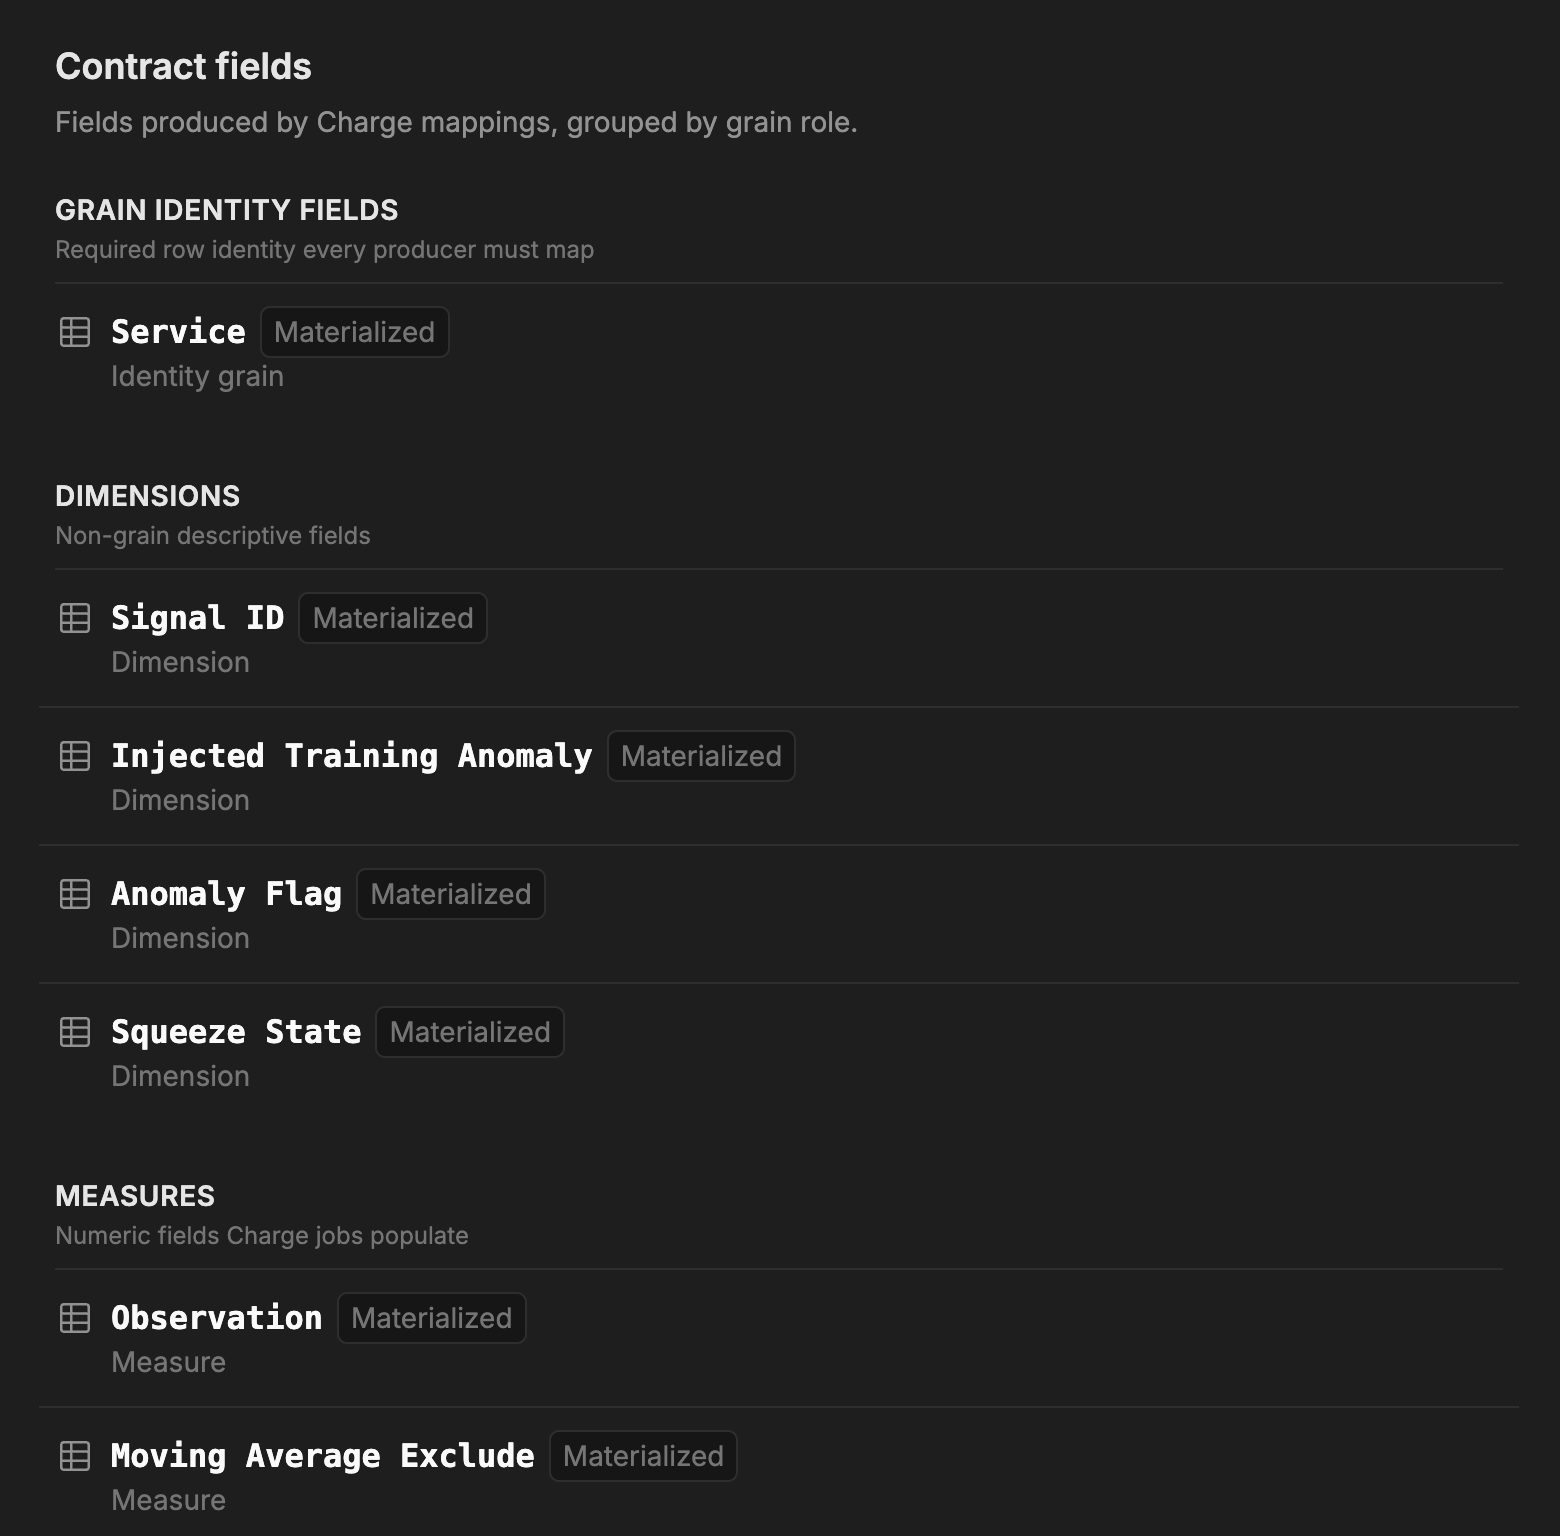
One definition per metric
Every field in the model is declared once: grain, dimensions, measures. Two teams cannot compute two versions of cost per customer.
Still comparing? How we compare to the FinOps tools you know →
Before you talk to sales
The questions we hear most often, answered directly.
Ask us the restOur data does not look like a cloud bill. Does this still work?
Yes. The engine is general purpose: it models the usage and pricing rules your data supports. Agent runs, support tickets, campaign budgets, labour hours and partner settlements all work when the data carries a quantity and an identifier. The starter kits model agent runs and revenue on exactly this footing.
How do you join revenue to cost without double counting?
By respecting grain. An agent run is not a support case, and a support case is not a customer. Cost rolls up to the level where revenue is recognised before the two are related. The naive join spreads revenue across rows that never earned it, or counts it twice.
Can we start with showback and add revenue later?
That is the path most teams take. Showback builds agreement on the allocation method. Once the cost side is agreed, revenue joins at the same grain and contribution follows without a second model.
Do you benchmark our unit costs against other companies?
No. We do not have their data, and neither does anyone claiming otherwise with any precision. You get what your unit costs and how it moved. What it should cost is your call.
Which Exivity product is this?
Exivity builds two products. Hypermeter is SaaS for cross-source cost allocation, FinOps analysis and unit economics. Exivity Core collects and rates usage and supports billing workflows, and can run in your own environment. You do not have to choose before you talk to us: bring the use case and we will recommend one, the other, or both.
Read before you book
Unit economics for cloud and IT
Choosing the unit, building cost to serve, and the allocation decision underneath.
Read →GuideAI token economics, explained
Cache-read tokens, reasoning tokens, tool tariffs, and why per-row ratios lie.
Read →LearnCost allocation
Shared cost, weighted methods, and why the total has to reconcile to the invoice.
Read →Measured on something else?
Cloud Financial Management
Control, allocate and optimize cloud spend
Explore →AI & Token Economics
Understand cost across tokens, models, agents and AI workloads
Explore →Service Provider Billing
Meter, price and bill services at scale
Explore →Sovereign & Hybrid Cloud
Financial control across cloud and datacentre
Explore →Put a margin next to every product line.
Discuss this use case with an engineer. Bring one cost source and one revenue source; leave with the setup that fits.