













Three things a token count cannot tell you
Provider usage exports tell you how many tokens you bought. They do not say what one case cost all in, whether it succeeded, or which agent spent it.
What one case cost, all in
Model calls, tool calls, and the CPU seconds and egress under them, rolled up to the support case, the booking, or the ticket. Not a per-call average.
Whether it succeeded
Cost per resolved case, per recovered booking, per closed ticket. Outcome data you provide sits next to cost, so a cheaper model that fails more shows up as more expensive.
Which agent, which tool
Every agent run charged to the product and customer that triggered it. Cache-read, reasoning, and tool tariffs priced the way your provider bills them.
From spend to value, in seven steps
Most tools stop at the third step. The questions that decide whether AI pays off are the last four, and they need cost joined to outcome at the right grain. Steps six and seven run on outcome and revenue data you provide.
- 01What did we spendInvoices, usage exports, GenAI spans
- 02Who should payThe team, product, or customer
- 03What consumed itModel calls, tool calls, GPU hours
- 04What activity did it supportThe agent run, the case, the booking
- 05What did that activity costAll in, at the grain of the case
- 06Did it succeedResolved, recovered, closed, or escalated
- 07What value did it produceRevenue recognised at the same grain
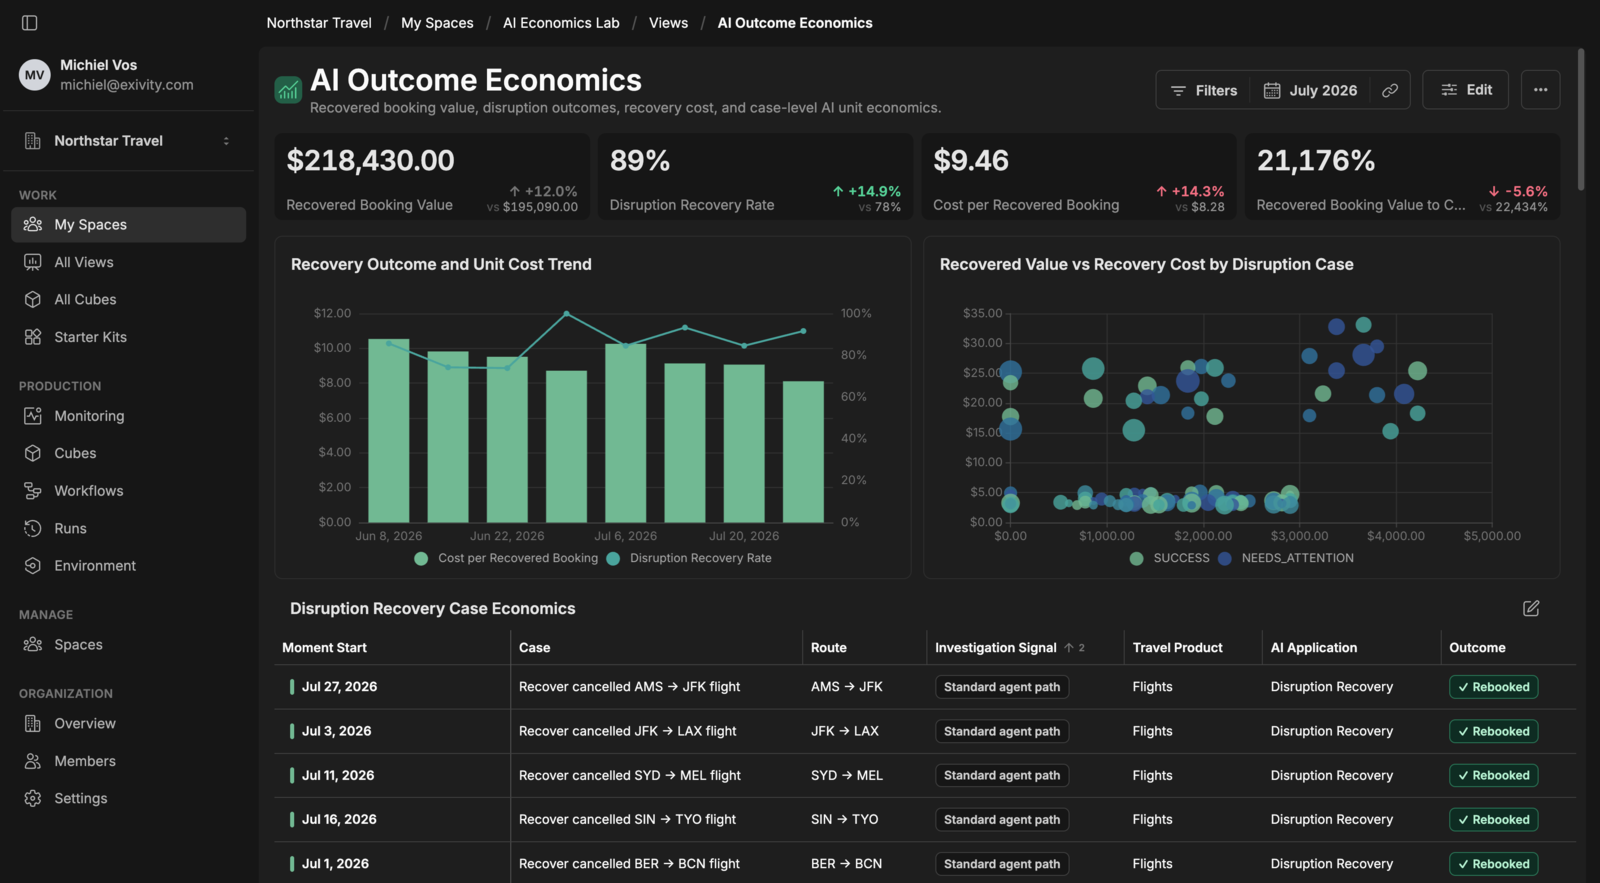
From the executive view to the LLM call
The same figure at every level: usage is priced, allocated to the run and the case, joined to the outcome, and read as cost per result. Every view below runs on demo data until you connect your own.
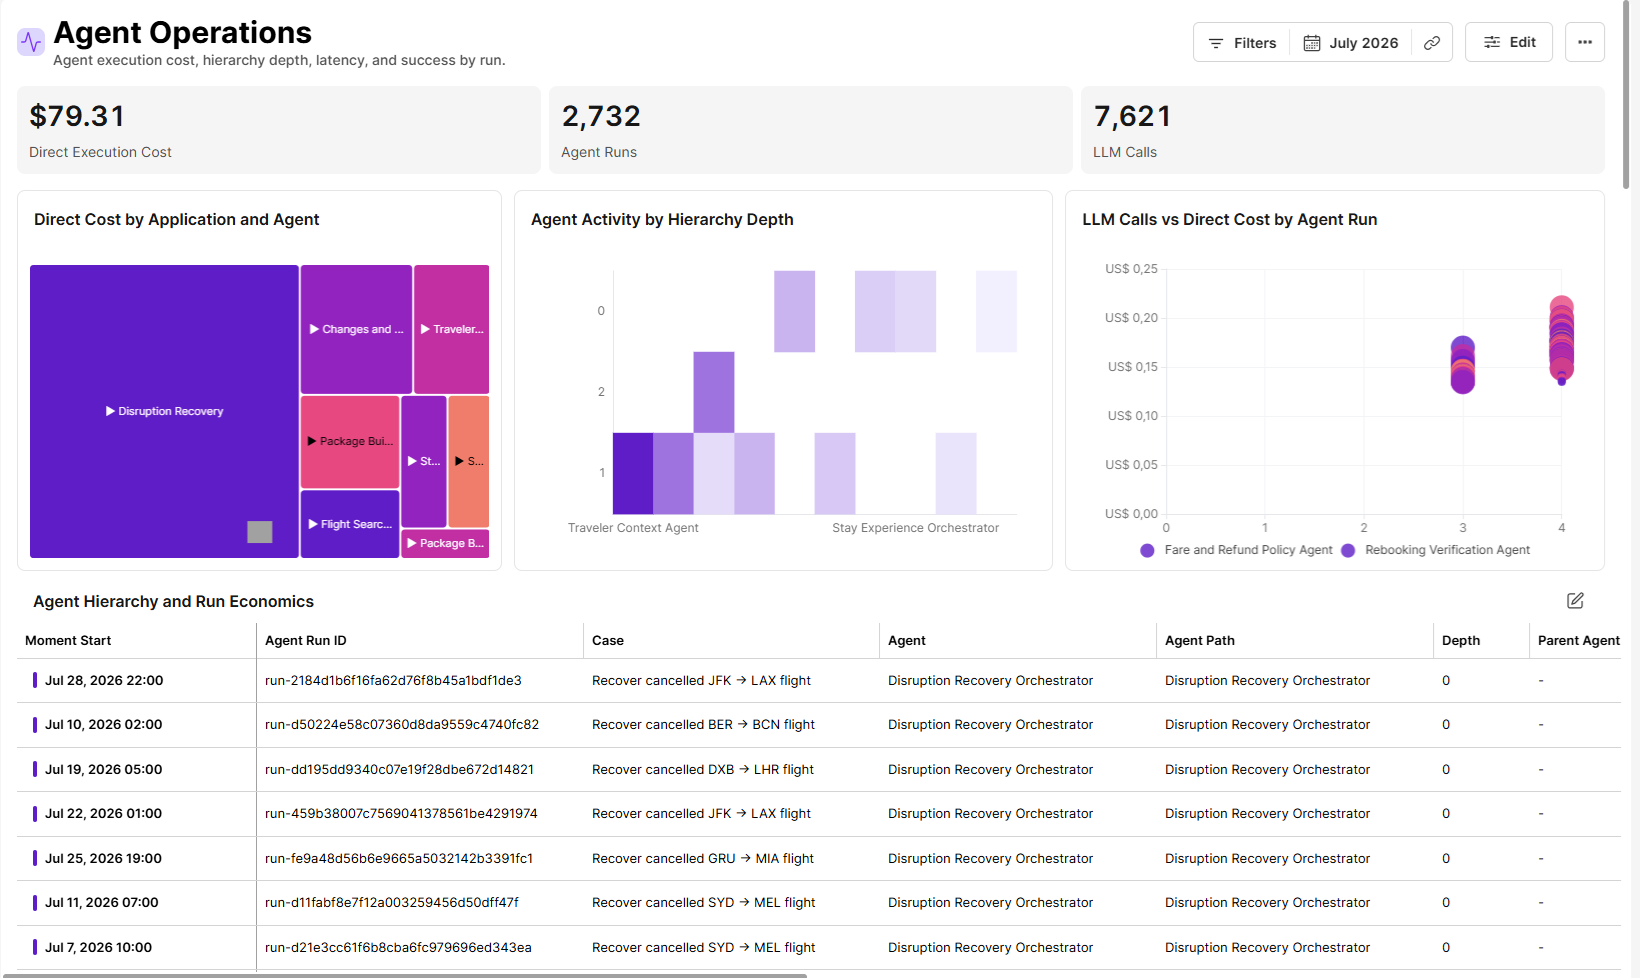
Drill from the case to the call
Open a case and follow it down. Agent operations, infrastructure attribution, service request demand. Same numbers at every level.
From model cost to contribution, stage by stage
Roll model cost up to the run, join labour cost, layer revenue on top, then compute contribution. An execution graph you can read.
What this takes to instrument
Cost per outcome is a join, and the join needs identifiers on both sides. Every figure traces back to the span or usage line that produced it.
Usage and infrastructure data
OpenTelemetry GenAI spans, provider usage exports, and the cloud bill for the infrastructure under the agents.
Outcome data with matching identifiers
The case, booking or task each run worked on, and whether it succeeded. Comes from your systems, joined on shared IDs.
A revenue feed, for margin
Cost per result works without it. Margin and payback need revenue recognised at the same grain, supplied by you.
Start from a working example, not a blank pipeline.
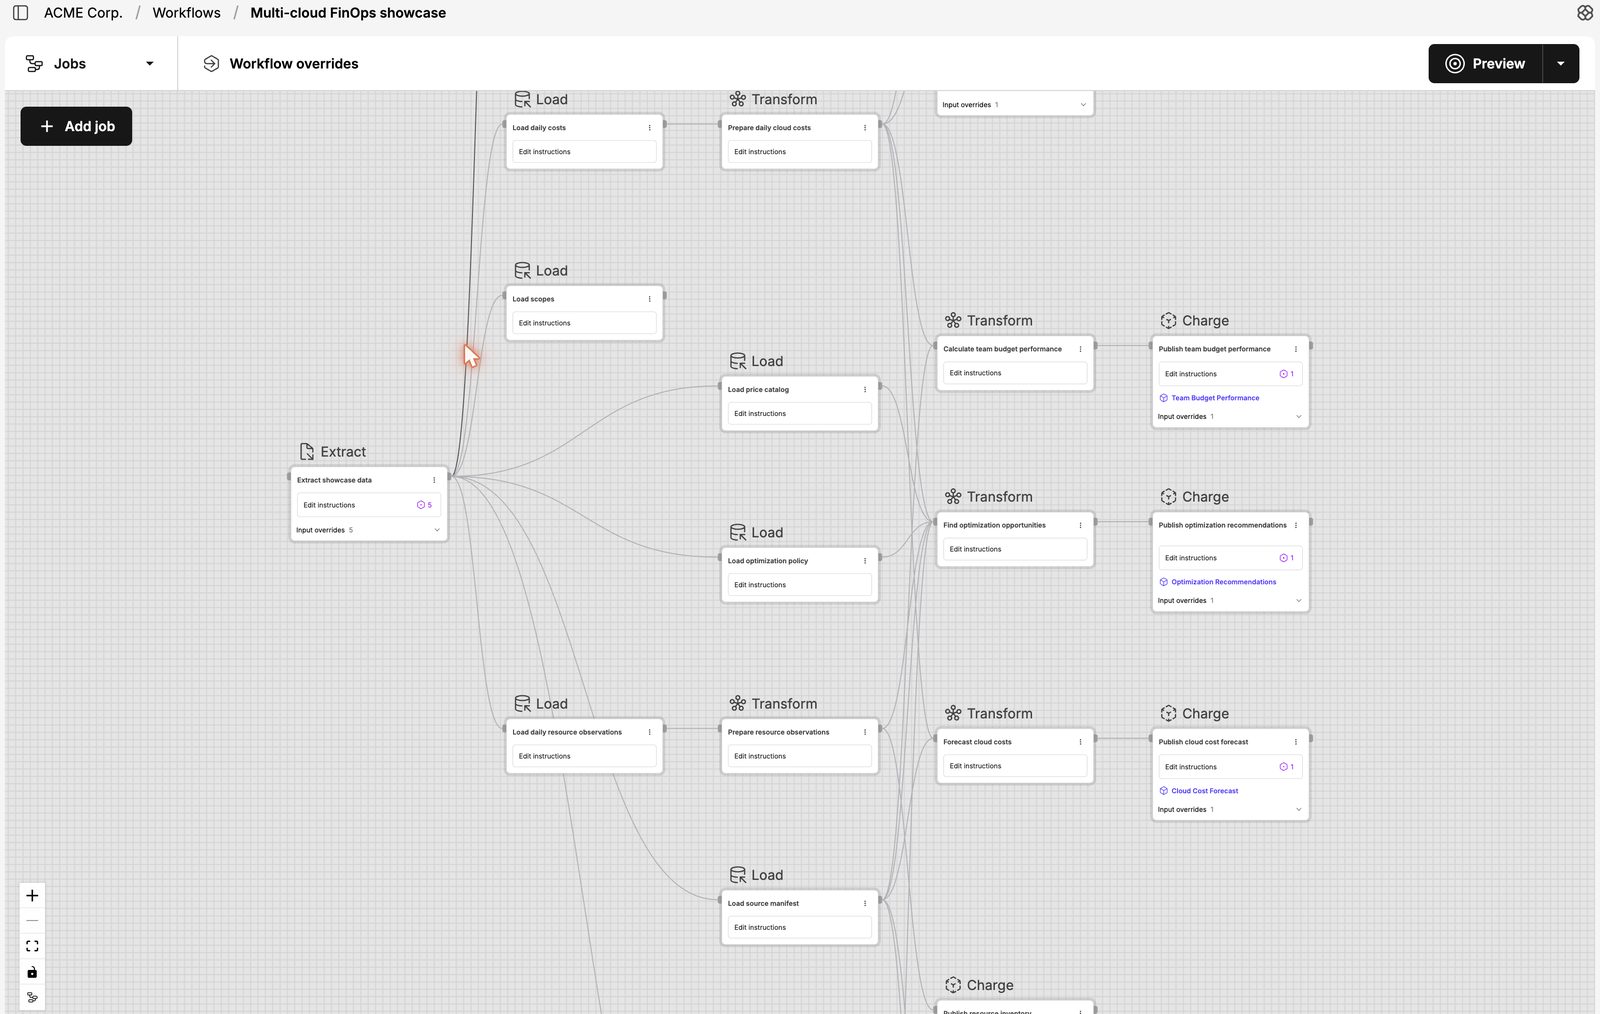
A starter kit is a real pipeline with working example data in place of yours — not your live margin. The extract, transform, and charge jobs a common use case needs, already wired to views. Connect one source, watch the numbers move, then swap in your own rules.
AI agent economics
Agent runs, model calls, tool executions, and the infrastructure under them, joined to revenue. Cache-read, reasoning, and tool tariffs priced the way the provider bills them.
Multi-cloud FinOps
Billing exports in, allocation by tag and cost centre, budget and chargeback views out. The rules you would have written, already written.
Then make it yours
Replace the demo source with your own and the views keep working. Change a rule and every number downstream picks it up on the next run. Nothing to rebuild.
Before you talk to sales
The questions we hear most often, answered directly.
Ask us the restHow do you get the token data?
From OpenTelemetry GenAI spans, provider usage exports, and any REST API. Exivity reads them on a schedule with read-only credentials you issue. Nothing is installed next to your agents and nothing is written back.
Why not divide token cost by the number of calls?
Because a call is not the unit that earns anything. The case is. Dividing at the call level spreads revenue across calls that never earned it, or counts it twice. Exivity rolls cost up to the case first, then relates it to the outcome and the revenue at that grain.
Does this replace our observability tool?
No. Your tracing tool tells you what happened and how fast. Exivity reads the same spans, prices them, charges them to a run and a case, and sets the result against what the case earned. Keep the tracing tool.
Can an automated optimiser use these numbers?
That is the point. While a human makes the model choice, a human also notices when a cheaper model fails more. As that choice gets automated, an optimiser working on spend alone will cut cost at the expense of every metric that defines success. Cost per outcome is what makes automated optimisation safe.
Do you meter tokens for billing as well as for attribution?
Yes. The same metering feeds both. Tokens can be rated and invoiced to a customer, and charged to the run and the case for unit economics. Which of those you need decides how we set it up.
Which Exivity product is this?
Exivity builds two products. Hypermeter is SaaS for cross-source cost allocation, FinOps analysis and unit economics. Exivity Core collects and rates usage and supports billing workflows, and can run in your own environment. You do not have to choose before you talk to us: bring the use case and we will recommend one, the other, or both.
Read before you book
AI token economics, explained
Cache-read tokens, reasoning tokens, tool tariffs, and why per-row ratios lie.
Read →LearnUnit economics for cloud and IT
Choosing the unit, building cost to serve, and the allocation decision underneath.
Read →CompareCloudZero vs Hypermeter
Both sell unit economics. The differences are hybrid coverage and whether the method is inspectable.
Read →Measured on something else?
Cloud Financial Management
Control, allocate and optimize cloud spend
Explore →Unit Economics & Business Value
Connect cloud and AI spend to customers, services and business outcomes
Explore →Service Provider Billing
Meter, price and bill services at scale
Explore →Sovereign & Hybrid Cloud
Financial control across cloud and datacentre
Explore →See cost per resolved case, on your own data.
Discuss this use case with an engineer. Bring one trace export; leave with the setup that fits your data.