













Three questions the cloud bill cannot answer
A billing export tells you what the provider charged. It does not say who caused it, whether it was planned, or what it should have cost.
Who owns this spend
Tagged, shared and committed cost is allocated by rules you define. What the evidence cannot support stays visible as an unallocated remainder, not a rounding error that vanishes.
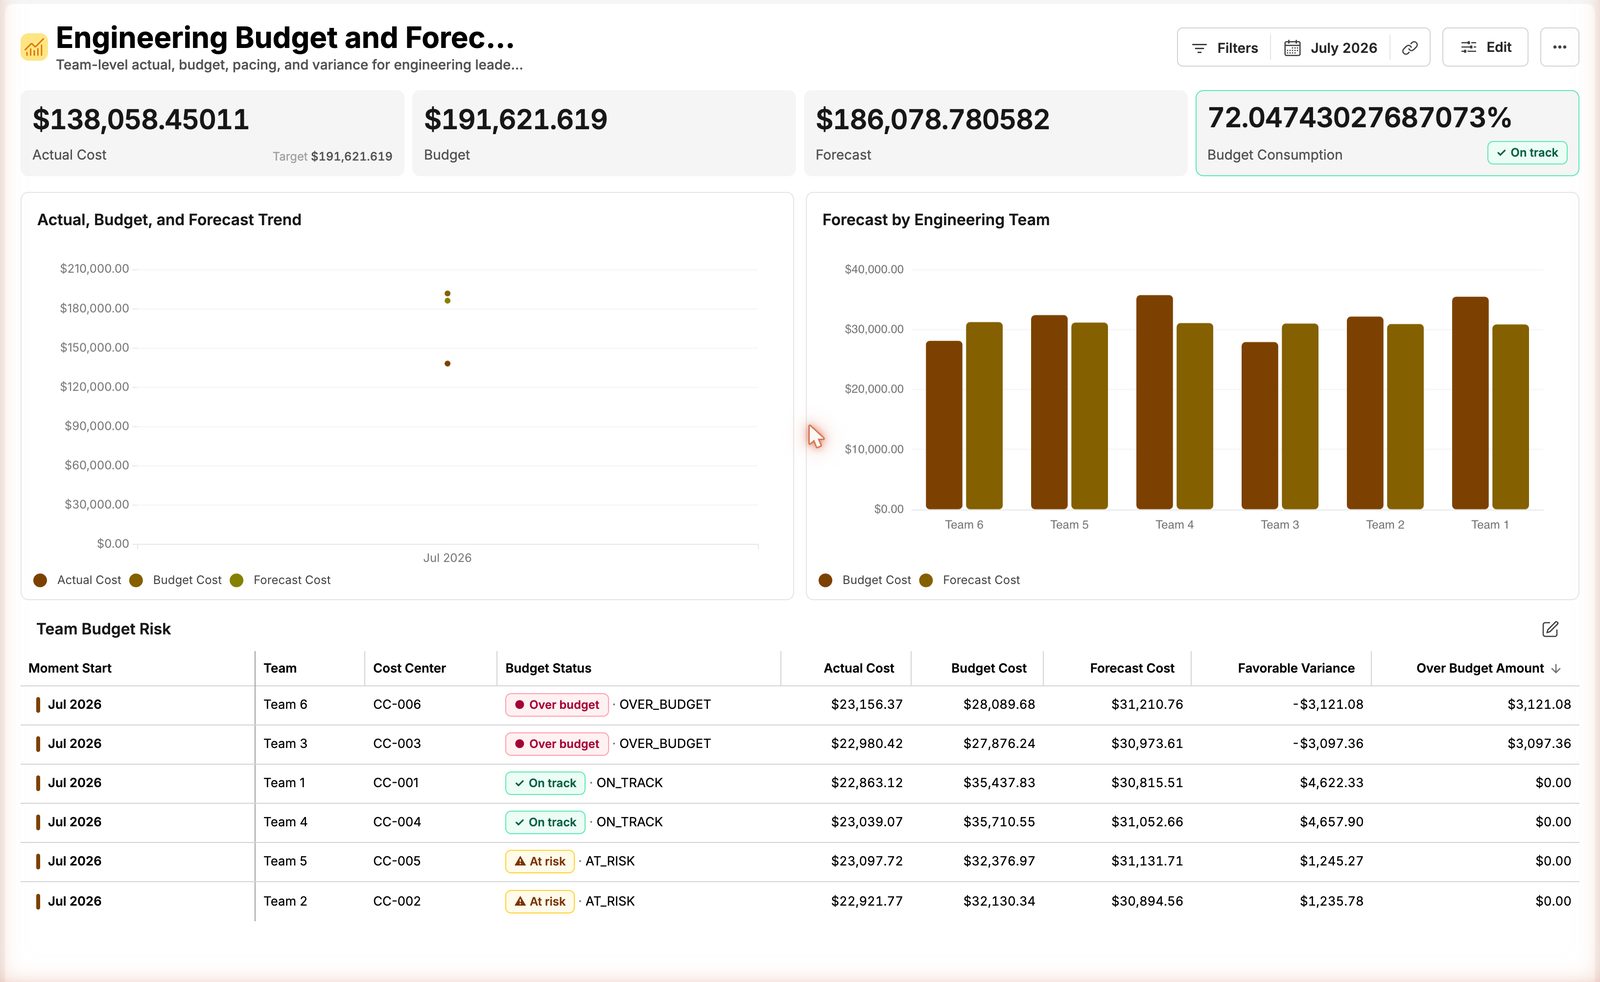
Are we on budget
Actual, budget, and forecast per team and cost center, with status bands on the view itself. Teams see it before month end.
What should we cut first
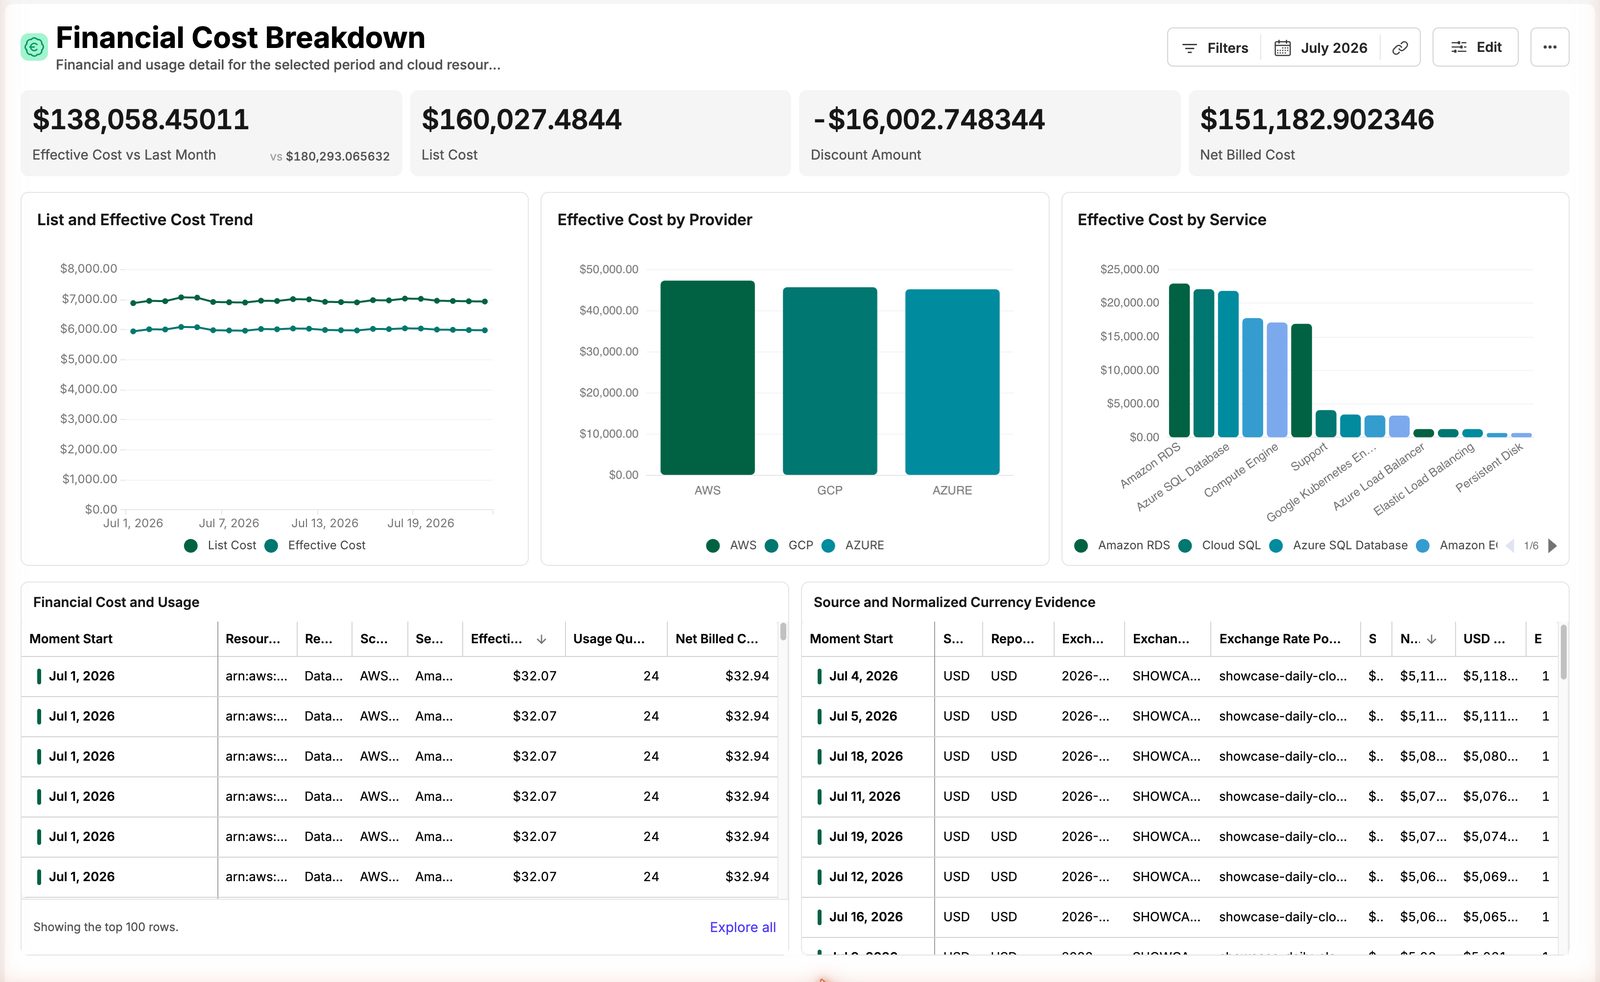
Idle and rightsizing candidates, modelled as views over the same dataset as cost. The number on the slide matches the bill.
Three inputs, one governed model
Connect the data you already have. Every figure downstream traces back to a billing line and the rule that allocated it, so a disputed charge resolves to an evidence lookup.
Billing exports
AWS CUR, Azure cost exports, GCP billing exports, or FOCUS-formatted data, read on a schedule.
Ownership data
Tags, cost centres, CMDB entries or IdP groups: whatever maps resources to the teams that own them.
Commitments and discounts
Reservations, savings plans and negotiated discounts, so allocated cost reflects what you actually pay.
Numbers each team can act on
Start from a working example on demo data, then connect your own billing exports. Every view reads from the governed model, so when the pipeline changes, the numbers keep their meaning.
Budgets teams see before month end
Actual, budget, and forecast per team and cost center, with status bands on the view itself.
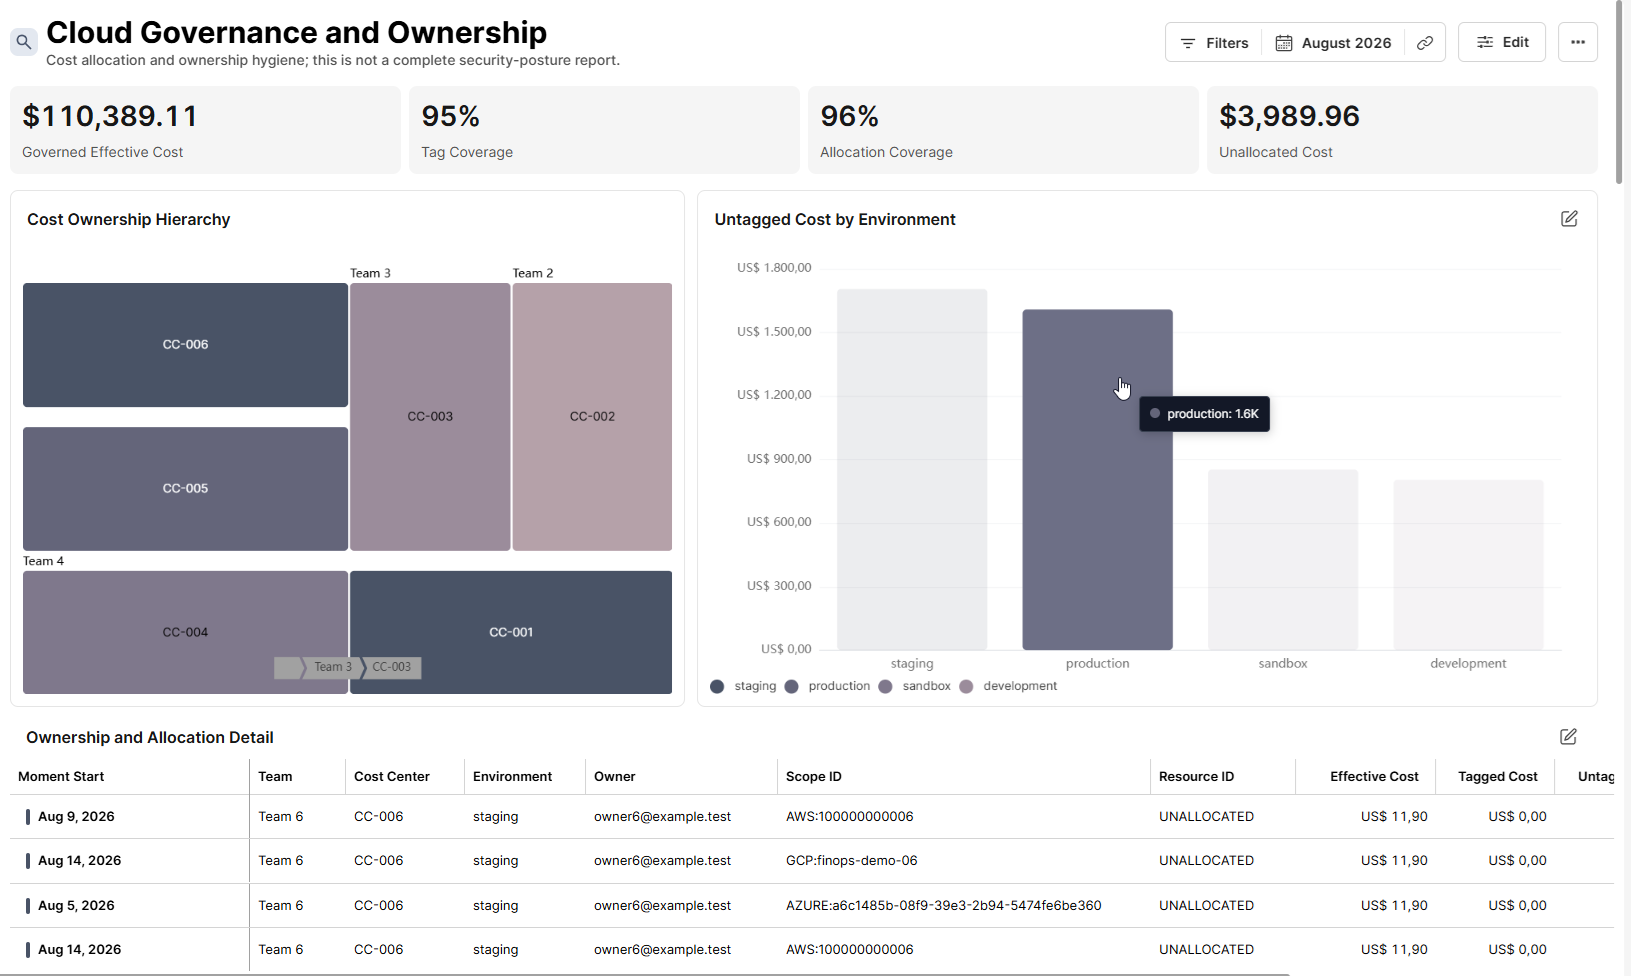
The unallocated remainder is a line, not a gap
Tag coverage, allocation coverage, and unallocated cost per environment on one view. What the rules cannot place stays visible.
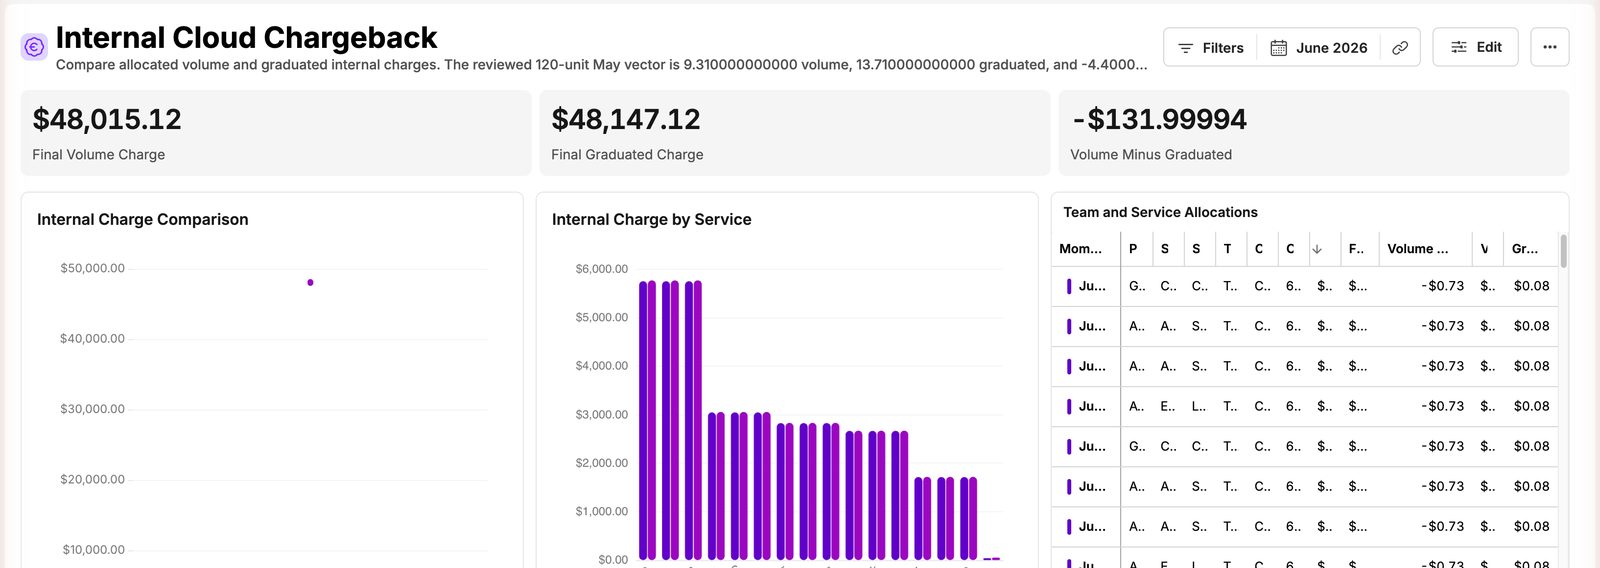
Chargeback with rules you can audit
Tiers, priority-ordered adjustments, proportional allocation. Every run publishes the calculation evidence, so the total always ties back to the bill.
Still comparing? The best FinOps tools for hybrid and multi-cloud, ranked →
Before you talk to sales
The questions we hear most often, answered directly.
Ask us the restHow is this different from the FinOps tool we already have?
Most FinOps tools allocate the cloud bill along dimensions the vendor chose. Exivity rates usage instead. You define the units, the allocation rules, and the metric definitions. They run against your configured sources on a defined schedule, and the same inputs give the same number every time.
We already have Power BI. Why this?
A BI tool charts whatever it is given. The hard part is upstream: collecting from your sources on a schedule, agreeing on one definition per metric, splitting shared cost by rule, and keeping reports intact when a provider renames a column. Exivity does that part, and exports CSV for the reports that still live in your BI tool.
Do you need access to our infrastructure?
No. It reads cost and usage from APIs, databases, and object storage on a schedule. It uses read-only credentials you issue. Nothing is installed in your environment and nothing is written back.
We cross-charge between legal entities and need a real document.
Formal cross-charging between entities is Exivity Core territory: it applies contract-specific rates and prepares invoice-ready charges, and it can run in the environment your policy requires. Say so on the call and we will scope it.
Which Exivity product is this?
Exivity builds two products. Hypermeter is SaaS for cross-source cost allocation, FinOps analysis and unit economics. Exivity Core collects and rates usage and supports billing workflows, and can run in your own environment. You do not have to choose before you talk to us: bring the use case and we will recommend one, the other, or both.
Read before you book
Cost allocation
Shared cost, weighted methods, and why the total has to reconcile to the invoice.
Read →LearnChargeback vs showback
What each requires, why most start with showback, and how to build an on-prem rate.
Read →CompareCloudZero vs Hypermeter
Both sell unit economics. The differences are hybrid coverage and whether the method is inspectable.
Read →Measured on something else?
AI & Token Economics
Understand cost across tokens, models, agents and AI workloads
Explore →Unit Economics & Business Value
Connect cloud and AI spend to customers, services and business outcomes
Explore →Service Provider Billing
Meter, price and bill services at scale
Explore →Sovereign & Hybrid Cloud
Financial control across cloud and datacentre
Explore →See your cloud bill by owner, not by invoice.
Discuss this use case with an engineer. Bring one billing export; leave with the setup that fits your organisation.