













Hypermeter is built by Exivity. Exivity Core, the metering and billing engine the same company builds, runs in production at telcos, service providers, public bodies and research institutes — organisations where a wrong cost number is noticed the same week. Hypermeter is that discipline applied to allocation and reporting.
Case studiesThree ways a cost number stops being believed
Producing the number once is a morning’s work. What breaks is everything around it: a join that has to be redone, a split nobody signed off, a question about which rows were counted. Three failures, and all three land on the same desk.
Nothing in the source names a customer
Resources live in a billing export, customers in a CRM, products in a service catalogue, cost centres in a finance system. The join between them is a tag policy and a CMDB that drift out of date, so it gets rebuilt by hand every month someone asks.
Nobody agreed how the shared platform is split
The container platform, the reserved capacity, the pipeline every team uses. The question is rarely whether to split it, but which driver to use: requests, core-hours or seats. Until that is agreed, the largest term in the number has no owner.
Every dispute turns out to be a grain dispute
Which rows were counted, at what grain, over which period, with which rate applied. Without lineage back to the source rows and a total that reconciles to the source figure, the answer has to be reconstructed in a spreadsheet after the meeting.
What Hypermeter delivers
Cloud cost allocation, AI and token economics, optimization and waste reduction, and anomaly reporting — from one governed model of your cost and usage data.
Cloud cost allocation
Every cloud cost allocated to the team, product or customer behind it, at the rates you actually pay. Shared platforms are split by measured use, and whatever cannot be allocated is shown as an explicit remainder — so the total always reconciles to the bill.
Cloud financial management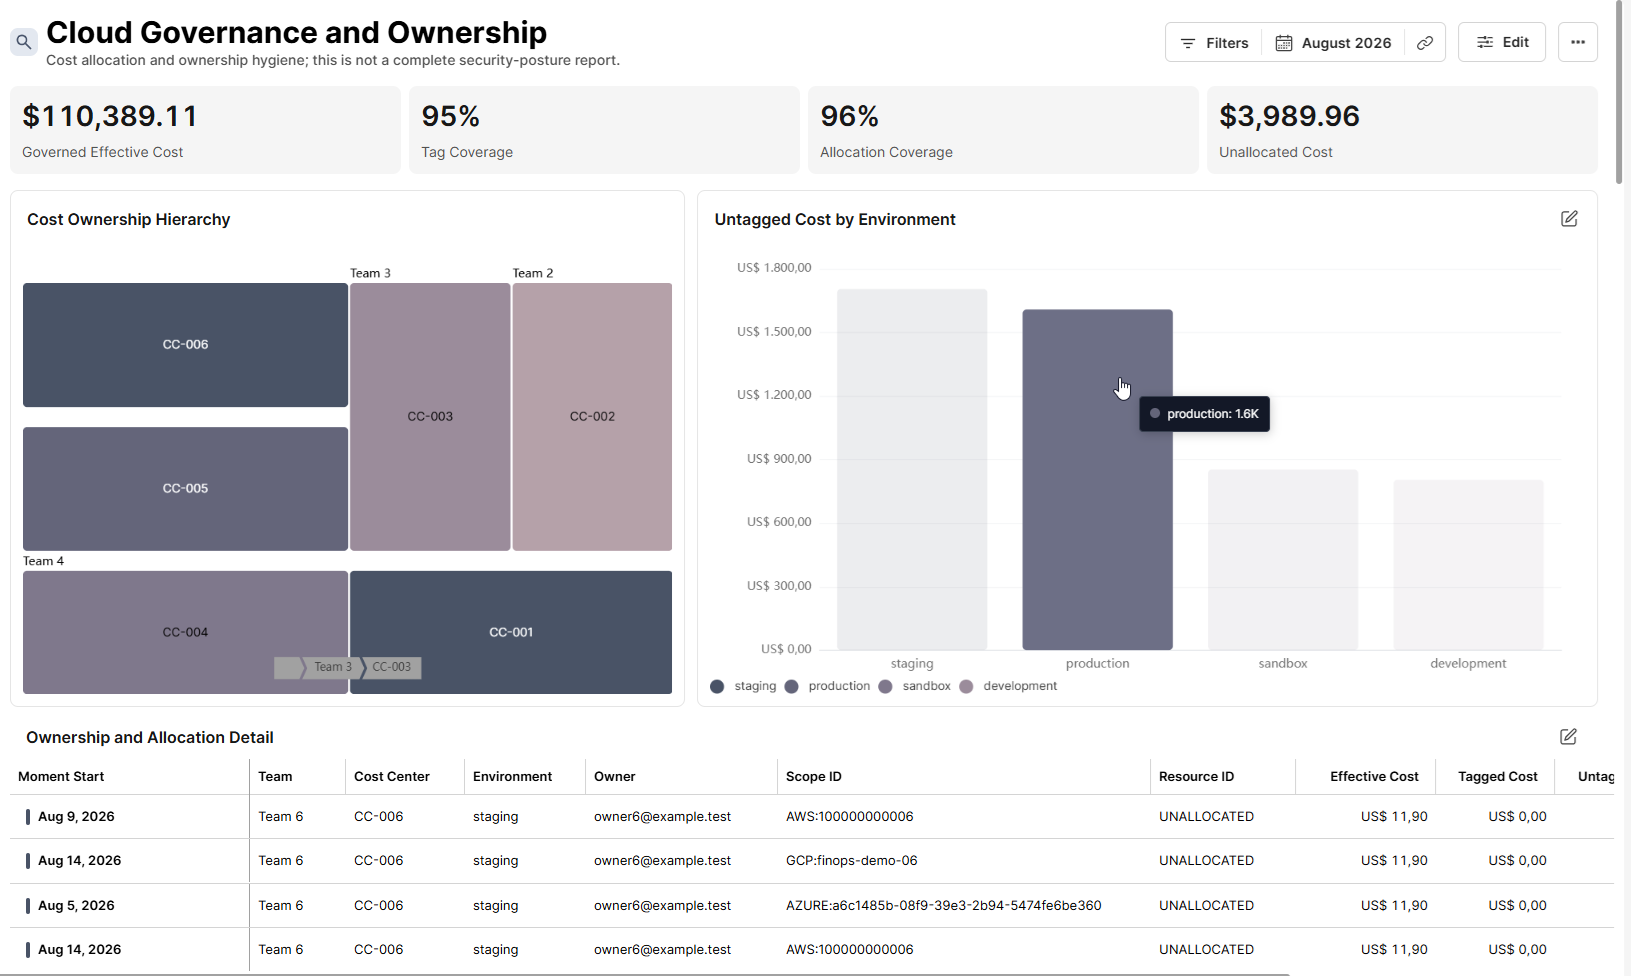
AI and token economics
Model calls, agent runs and the infrastructure under them, priced and connected to the products and customers they serve. Add outcome data to measure cost per result, and revenue to see whether AI is paying off.
AI and token economics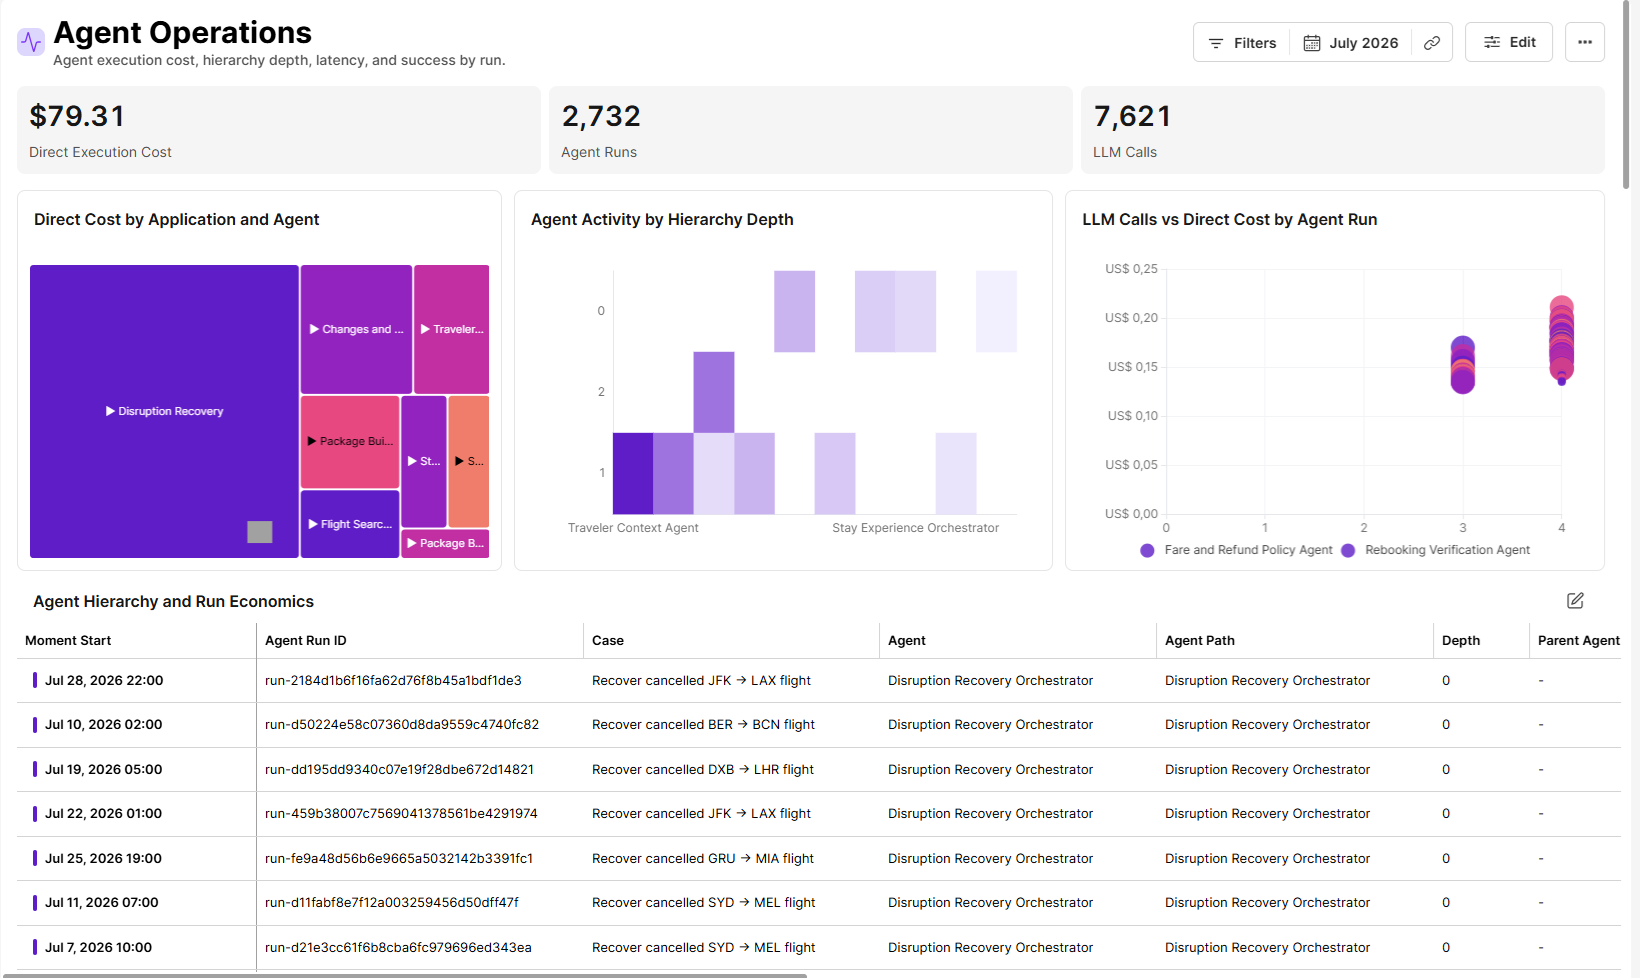
Optimization and waste reduction
Idle resources, rightsizing candidates and purchase-model changes, ranked by potential savings and grouped by team. Waste is quantified next to actual spend, so the case for acting is already on the page.
See it on your data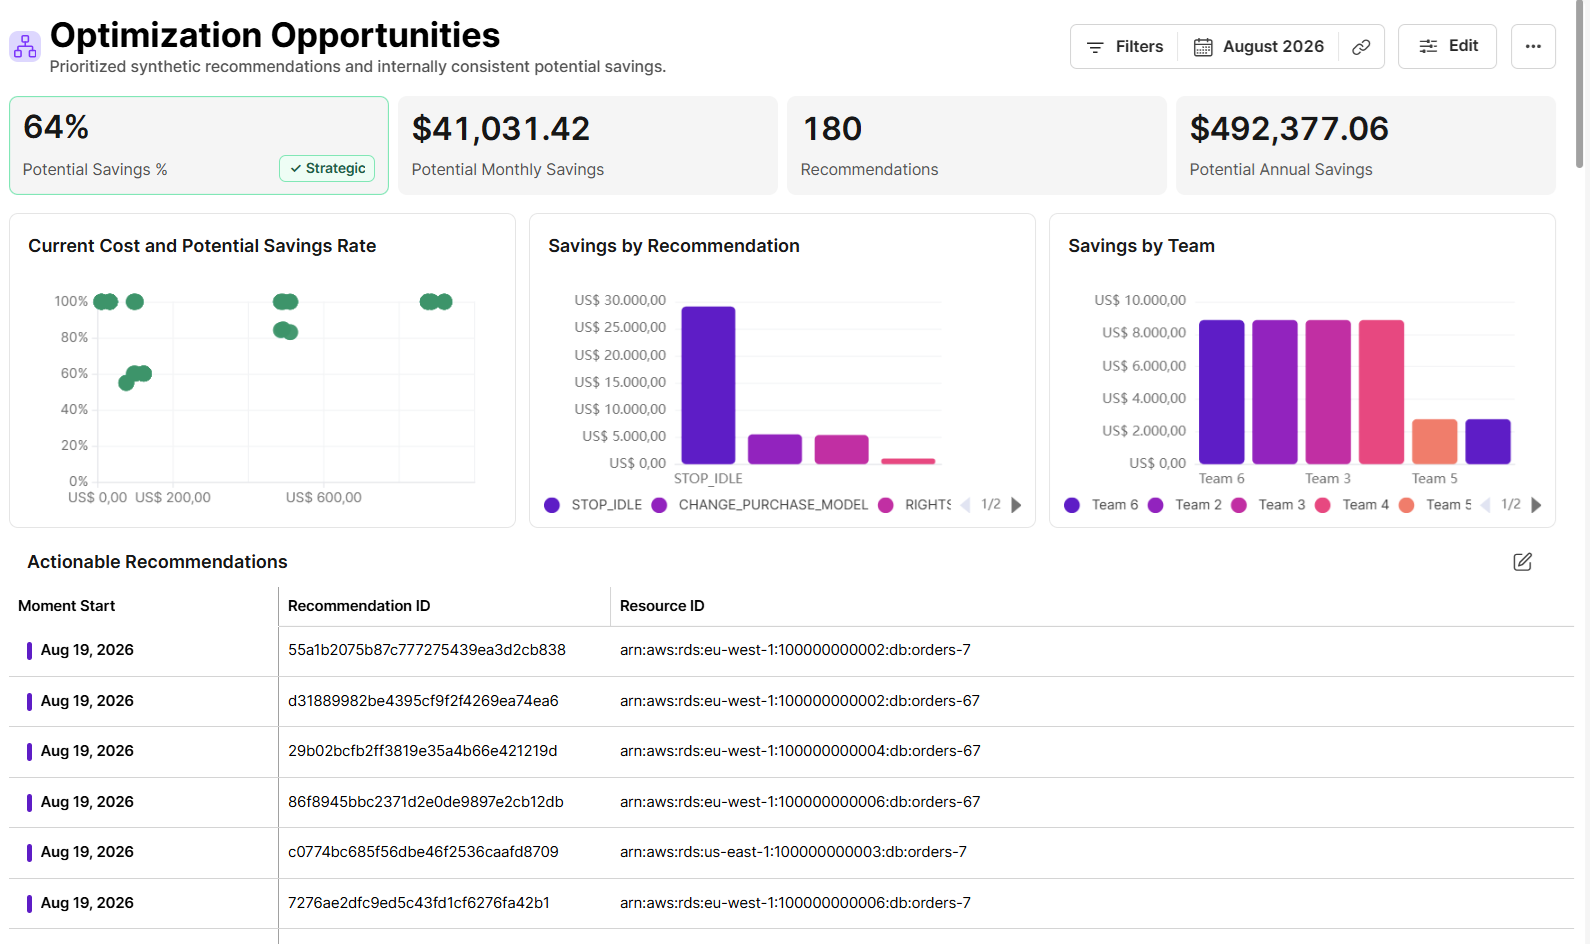
Anomaly reporting and forecasts
Unusual spend is flagged early against expected ranges computed from your own history. Forecasts per team and cost centre state their method, so month end brings fewer surprises and alerts your teams can act on.
See it on your data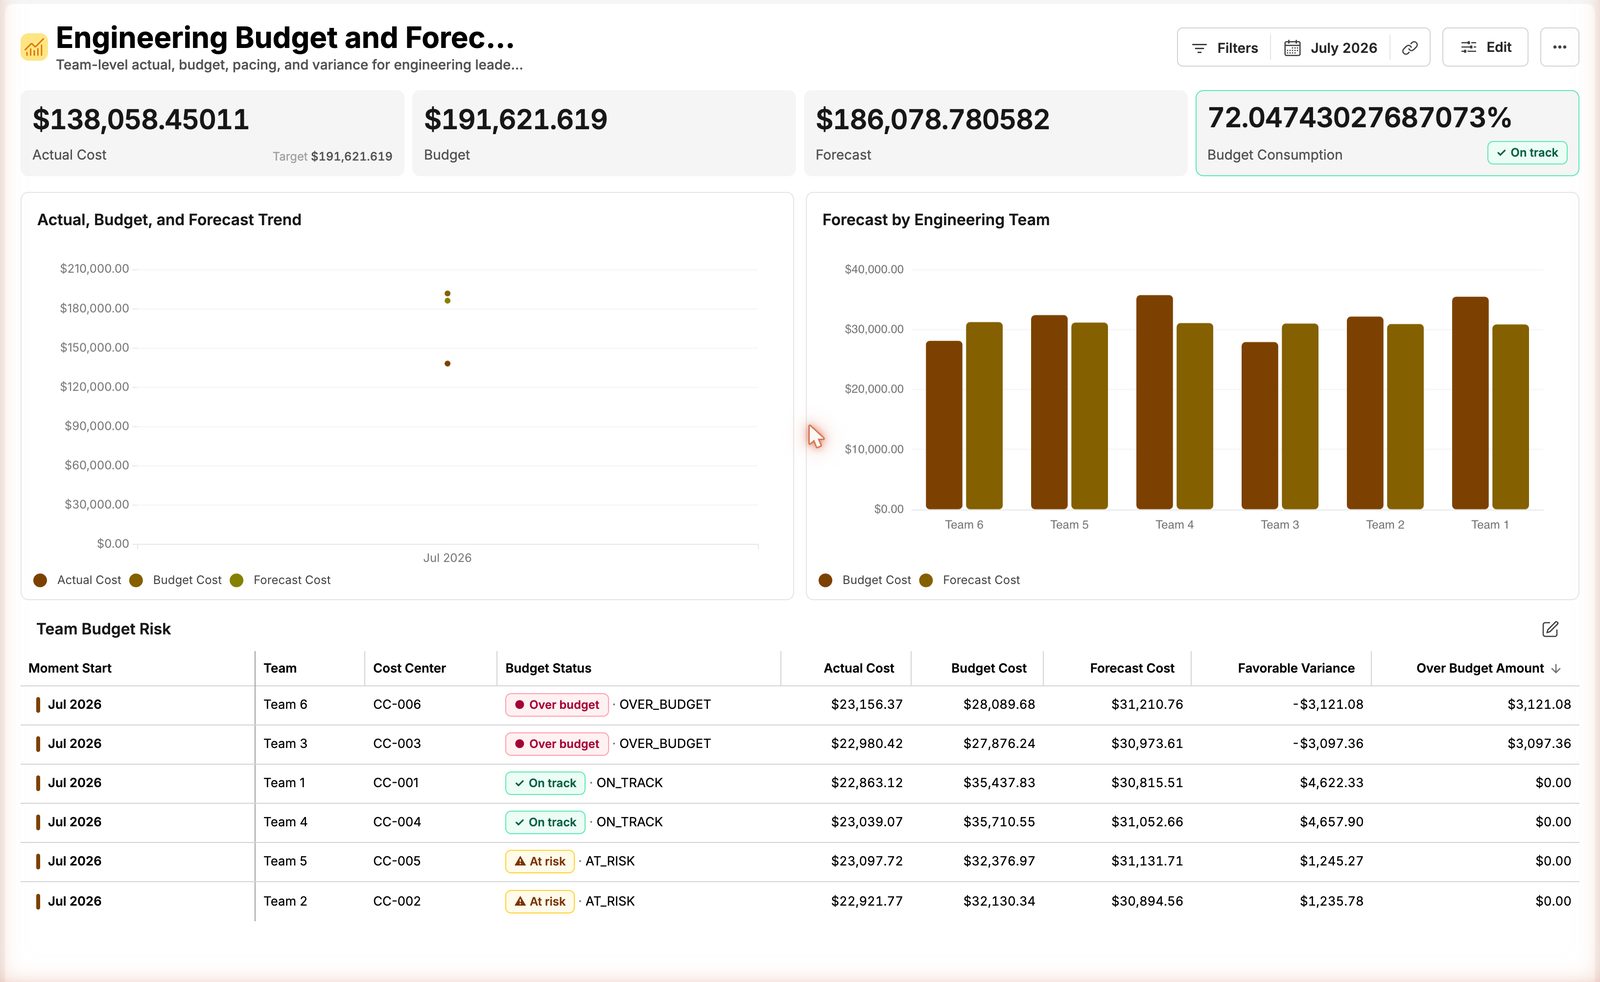
How it works
Three steps. The technical detail — pipeline jobs, the reporting model, scheduling and the API — lives in the documentation.
- 01Connect your sources
Billing exports, AI usage data, databases and APIs, read on a schedule with read-only credentials you issue. Nothing is installed in your environment.
- 02Apply your rules
Your rates, allocation rules and metric definitions run in one governed model. Every figure traces back to its source line, and the unallocated remainder stays visible.
- 03Report and act
Dashboards per team, anomaly alerts, forecasts, CSV export and a full API into your finance systems.
Read the documentation for the full tour, and integrations for every source it can be pointed at.
Deployment and access, stated plainly
Hypermeter is multi-tenant SaaS. Ingestion is a scheduled, read-only pull against credentials you issue; nothing is installed in your environment. The access model is specific enough to point a report at the customer it is about.
Organisation isolation
Each organisation's data is separated at the platform level, not filtered at the report level.
Spaces and cube grants
Access is granted per space and per cube, so a team gets the model it needs and nothing adjacent to it.
Field hiding and row constraints
Sensitive columns can be hidden and rows constrained, so the same model serves an internal team and an external customer.
Write-only secrets
Credentials go in and never come back out. They do not travel with configuration when a setup is copied or exported.
The full access-control and administration tour lives in the documentation.
Starter kits: working reporting on day one
A kit builds a real, populated model rather than a sandbox. Everything it creates is ordinary and fully editable — the same extracts, transforms, cubes and reports you would have built yourself — so it is a starting point rather than a demo you eventually throw away.
Multi-cloud FinOps
Cloud accounts, shared platform cost, allocation rules and a chargeback report, connected and populated. The shape most organisations need before anyone customises anything. How multi-cloud FinOps tools compare.
AI agent economics
Agent runs, model calls, tool executions and inference infrastructure, joined to revenue and contribution margin. AI cost and unit economics.
What Hypermeter does not do
Scope, stated up front, so evaluations start from accurate expectations.
- It does not act on your infrastructure
- No write access, at all. It reads with credentials you issue, and it will not resize, schedule, stop or reconfigure anything you run. Whether a vendor may change production is the one genuinely contested question in this category, and this is our answer to it rather than a feature we have not built yet.
- Batch, not streaming
- Data arrives on a schedule and is processed in runs. There is no real-time ingestion, and a run that cannot complete correctly is blocked rather than left half-finished.
- Preset-based reporting, not free-form SQL
- Reports are composed from the vocabulary the model declares rather than from arbitrary SQL in the reporting layer. That constraint is what makes a calculation verifiable while it is being written; it also means some ad-hoc questions belong somewhere else.
- No external benchmarking
- It will not tell you how your cost per unit compares to other companies. It does not have their data, and neither does anyone claiming otherwise with any precision.
- No black-box prediction
- Every forecast states its method, training window, assumptions and error history, and reruns identically for anyone who checks. If a number cannot be explained, it is not shown.
When you need an invoice, not an explanation
Exivity Core is actively developed and fully supported. It prepares invoice-ready output and runs self-hosted, including air-gapped. Hypermeter does not replace it, and existing deployments are unaffected.
The two connect by data: where your data policy allows it, the engine exposes rated charge records that Hypermeter reads like any other source. If your output is a bill somebody pays, start on the other page.
Questions an evaluator asks
Pricing is scoped to your organisation and licensed separately from Exivity Core. How pricing works.
Ask us the restHow does data get into Hypermeter?
On a schedule, in batch runs, from HTTP and REST APIs, relational databases, object storage and files, cloud billing exports included. There is no streaming ingestion. Exivity Core is one useful source among several rather than a prerequisite.
What exactly does Hypermeter need read access to?
The specific sources you want modelled, and nothing adjacent to them: a billing export bucket, a read-only database user, an API token scoped to the endpoints that carry usage. Nothing is installed in your environment, because ingestion is a scheduled pull rather than an agent.
How is shared cost split when nothing obviously drives it?
By a driver you choose and Hypermeter meters — requests, core-hours, storage, throughput, tokens. A cost that nothing measurable drives is reported as unallocated, with its amount, rather than distributed by an arbitrary rule.
Can we put a report in front of the customer it is about?
Yes. Access is granted per space and per cube, sensitive columns can be hidden and rows constrained, so the same model serves an internal team and an external reader without a second copy of it.
See the number on your own data
A demo scoped to your question, or a starter kit you can read on the first day.
Demos are 30 minutes, scoped to your question. We reply within 24 hours.