Rise and fall of Gnocchi
Not long after Ceilometer was initially launched there were reports of performance issues, specifically affecting Nova host systems. There have even been cases where Ceilometer could bring down a Nova host because of skyrocketing CPU usage. Fortunately, some time after Ceilometer was released, a new component called Gnocchi was announced outside of the OpenStack project. The Gnocchi project was an open source initiative tightly integrated with the OpenStack ecosystem. Its aim was to provide a time-series storage engine with a REST API in order to solve some of the known Ceilometer scalability issues.

Gnocchi therefore quickly became a recommended component for OpenStack deployments where there was a requirement to collect metrics for use cases such as billing. Gnocchi is still referenced in many OpenStack documentation articles today but was maintained by three primary developers only (sponsored by Huawei and Red Hat) and in 2018 both companies dropped their support for it.
Red Hat seems now to be focusing on their Service Assurance Framework as a Gnocchi replacement (and that of a few other components such as Panko). It looks as if Prometheus will play a key role as the time-series data storage in the Red Hat SAF offering but this might not cover pure billing use cases for users that require high levels of accuracy. The Prometheus software is not well suited for every billing use case, according to a statement on their website:
- "If you need 100% accuracy, such as for per-request billing, Prometheus is not a good choice as the collected data will likely not be detailed and complete enough"
Additionally, Prometheus does not support multi-tenancy so you would still need to deploy a Prometheus instance for every tenant, which is impractical in a large Cloud or Managed Service Provider scenario. That said, not all billing use cases do require per-request accuracy. In some cases it may be sufficient to query statistical information for a date-range in order to get usable CPU and memory consumption metrics (for example). If this suits your needs then Prometheus could be your best bet and at Exivity we have integrations available that will enable you to interface with the Prometheus API.
Ceilometer + Monasca = Ceilosca
There is another alternative in the form of a monitoring component, released a few years ago, called Monasca. This offers a highly scalable multi-tenant monitoring engine which can also be used for billing use cases, and with the introduction of the Ceilometer-Monasca integration component Ceilosca it is now possible to register a Monasca Publisher with the Ceilometer Agent.
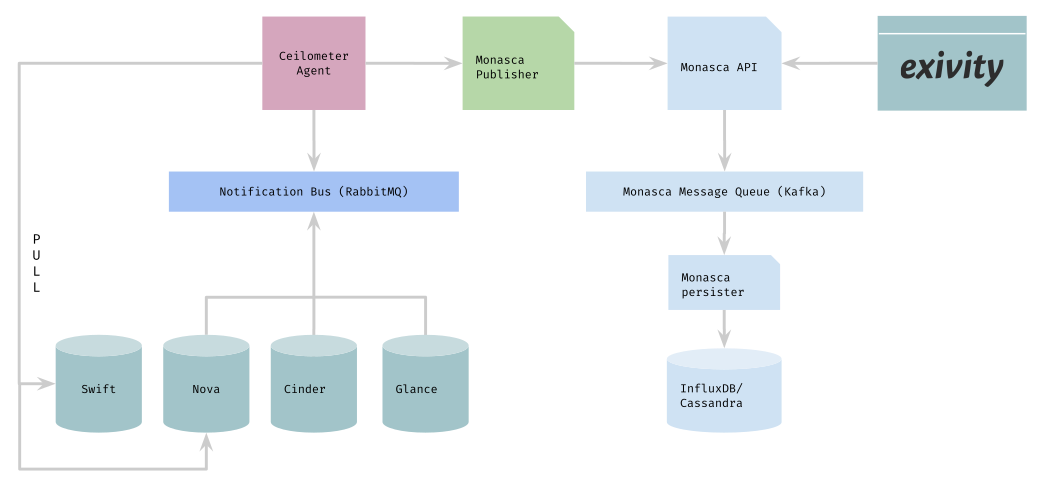
This enables a modern, high performance REST API while cherry picking the required meters from Ceilometer and could very well become the recommended approach going forward for OpenStack billing use cases. The CloudKitty rating engine from the OpenStack family also integrates with Monasca, as does the Exivity Unified Extraction Engine.
To prepare your OpenStack environment for Ceilometer and Monasca, take a look at the following tutorial. Although this tutorial focuses on the OpenStack-specific CloudKitty rating engine it also applies to more advanced billing systems such as Exivity.
Back to Basics?
What if you don’t have a large OpenStack infrastructure, have a straightforward billing use case, and/or don’t want to be dependent on multiple OpenStack components such as Ceilometer and Monasca? In such cases, you can still pull real-time inventory metrics directly from the REST APIs provided by the OpenStack core components.
.png?width=1500&height=647&name=c726f27f1d15147f5cbc95a013df346647ec3fef-1500x647%20(1).png)
Data retrieved in this manner won’t have extensive statistical information such as that provided by Ceilometer, Gnocchi and Monesca but Exivity has templates available for pulling data directly from Nova and Cinder which you can start using today for a number of different billing use cases. We have OpenStack customers running ten thousands of VMs for which we acquire metrics in a matter of seconds.
So in the event you find yourself lost in the OpenStack Telemetry forest, just remember you can always go back to basics!